Multi-dimensional Sentiment Analysis in a Spreadsheet
Sentiment analysis aims to identify and extract subjective information from texts. This is usually done in terms of finding and aggregating positive, negative or neutral expressions in the texts. Gavagai uses advanced algorithms to go “beyond polarity” and provides multi-dimensional sentiment classification for the emotional states “hate”, “desire”, “love”, “skepticism”, “violence”, and “fear”, in addition to “positive” and “negative”. Using a free API key you can use our multidimensional sentiment scoring right in your own Google Spreadsheet.
The add-on works like this:
- You enter texts in individual cells in a column in the sheet
- You select the text cells for which you want to analyze the emotional states
- You click a button which sends the texts to the Gavagai API and you get back the measurements
- The measured emotional state values are inserted into individual columns for their respective emotional state For each text and each emotional state, you get two values, the score and the normalized score
- The score is the total measured expression of the emotional state in a text. For example, in the text “I love hamburgers but I really hate fries.” the score for love could be 1 and the score for hate could be 2.
- The normalized score is the ratio of a score to the total expression of all emotions in a text. In the above example, the normalized score for love would be 1/3 (the score for love divided by the total score for all emotional states) and the normalized score for hate would be 2/3.
The rest of this page describes how to get started using the add-on.
Give permissions to the add-on
When you start the Gavagai Tonality add-on you will need to give it some permissions to make calls to the Gavagai API and to store your preferences.
Get an API key
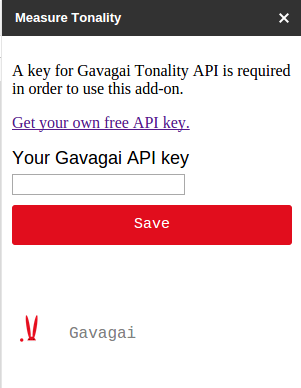
Next, you will see the screen for entering your API key. If you don’t have a key you can get a free API key here. Then enter it in the API key field and click save.
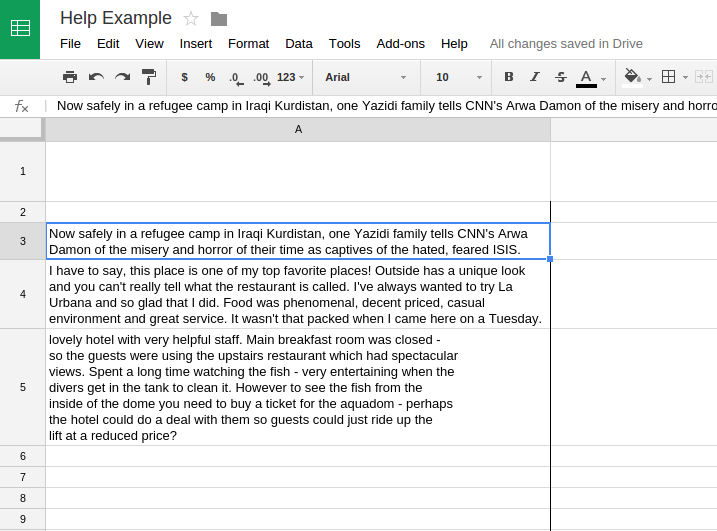
Add some texts
Add texts in a column (one text in each cell). Make sure there are at least two empty rows above the top most text (since columns will be added to the right of the text and they will contain headers in the two first rows).
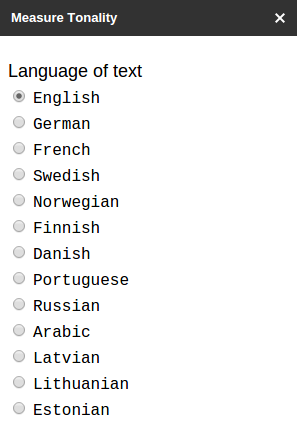
Select the language of the texts
Select the text cells and click
“Measure tonality”
Select the texts (or whole column) of texts and click “Measure tonality”. This will create the columns shown below. Results will be shown in the new columns and in the text field in the sidebar. As you can see below, there are eight columns for the scores and eight for the normalized scores.


